OUR NEW WEBSITE IS COMING UP SOON. KEEP VISITING THIS PAGE FOR MORE UPDATES. ----- JOIN OUR WhatsApp BROADCAST LIST, GIVE MISSED CALL ON 08893534646

A Sebi Registered Company

Indian Market View is powered by Finaux Alpha 6 Services Private Limited (SEBI Registration Number INA100008416 )

Stock Market is uncertain and we are here to make it less riskier

Technical and Fundamental parameters are the key principles for making valuable decision fruitful.

Investing in financial instrument is now no more risky

Stop loss is a bliss for financial market.

Mutual Fund - Coming Soon

Destiny works occasionally but regular and long term Investment in mutual funds will shine your destiny on prolong basis.

Our research organization is purely based on trust benevolence ethics.

A believe is to gain your trust with having a clarity on the basis of reports and live updates submission.

Tuesday, October 17, 2017

Update on Nifty levels, Bank Nifty levels & Derivative Outlook of the day 17th Oct 2017


Update on Nifty levels, Bank Nifty levels & Derivative Outlook of the day 17th Oct 2017

Nifty 10230 /Sensex 32182/ Bank Nifty 24361

34 Advances / 16 Declines/ 0 Unchanged

Benchmarks hit record high on positive macro data
Indian equity benchmarks started the Diwali week on a very strong note, with Sensex and Nifty hitting all time highs and ending above their crucial 32,600 and 10,200, respectively for the first time ever. Markets started the trade with gap-up opening, as sentiments remained jubilant with report that India’s exports recorded a robust growth of 25.67 percent to $ 28.61 billion in September, mainly on account of rise in shipments of engineering, chemicals, and petroleum products. Imports too rose by 18.09 percent to $ 37.59 billion in September from $ 31.83 billion in the year-ago month and the trade deficit narrowed to 7-month low of $ 8.98 billion in the month under review from $ 9.07 billion in September 2016. Some support also came with IMF chief Christine Lagarde’s statement, who just days after the International Monetary Fund (IMF) slashed India’s GDP growth rate to 6.7 percent in 2017, slower than the 7.2% it had forecast in April, said that the Indian economy is on a firm footing.
Traders booked most of their initial gains in afternoon session, but fresh amount of buying in late trade helped markets to end near intraday high levels. Sentiments turned positive with data showing that India’s annual wholesale price inflation (WPI) eased to 2.60% in September from the provisional 3.24% in the previous month. Build up inflation rate in the financial year so far was 0.97% compared to a build up rate of 3.44% in the corresponding period of the previous year. Adding to the optimism, Niti Aayog Vice Chairman Rajiv Kumar said that slowdown in India's economic growth that began in 2013-14 has bottomed out and Gross Domestic Product (GDP) is likely to grow 6.9 to 7 percent in the fiscal 2017-18 and 7.5 percent in 2018-19. Traders also took some support with the private report indicating that India’s economy will grow by more than 10% annually in the coming decade, buoyed by demographics, reforms and globalization.
Firm opening in European counters too aided sentiments, as investors gear up for the latest in political news coming out of Austria, Spain and the UK. Euro zone’s trade surplus shrank in August as the stronger euro fueled an import boom that was only partly offset by a rise in exports. Asian markets ended mostly in green terrain on Monday, as commodity prices advanced. China’s producer price inflation unexpectedly accelerated to a six-month high in September as a construction boom shows no signs of abating.
Back home, investors took note of a poll report that the Nifty50 which rose to a fresh record high just ahead of Diwali week may come under pressure and could well move below 10,000 by December 2017. There is a sense of caution as valuations remain high and the recent macro data is raising questions on the stable macro picture which India had among other key emerging markets. Meanwhile, Godrej Agrovet made a stellar debut today and went home with a gain of around 30% on BSE, the initial public offer was oversubscribed 95.41 times.

FII’s Activity 16th-Oct-17

The FIIs as per Monday’s data were net sellers in equity segment, while they were net buyers in debt segment, according to data released by the NSDL.
In equity segment, the gross buying was of Rs 5505.38 crore against gross selling of Rs 7060.48 crore. Thus, FIIs stood as net sellers of Rs 1555.10 crore in equities.
In the debt segment, the gross purchase was of Rs 887.31 crore with gross sales of Rs 436.75 crore. Thus, FIIs stood as net buyers of Rs 450.56 crore in debt.

Now what to expect ?? 

Image result for happy tuesday


Nifty Levels 

Image result for nifty

Above 10260 will see more upside rally till 10400 and then to 10550---10700 mark else it could test its support level of 10000 again.

Closed below 10000 will see more downside panic in Nifty. Trade within a range 

Bank Nifty 


Image result for nifty


Above 24900 will see more upside rally till 25050 and then to 25300---25550 mark else it could test its support again. 

Break and sustain below 24400 will see more downside panic till 24000 and then to 23875---23750

Trade within a range

Daily Derivative Outlook 17th Oct 2017


• Nifty October 2017 futures closed at 10255.95 on Monday at a premium of 25.10 points over spot closing of 10230.85.

• Maximum call writing seen at 10400, Maximum put writing seen at 10200. 
• Maximum positions are at 10200 CE and 10000 PE. 

• FEDERALBNK (21.5%), COLPAL (14.9%), ICICIPRULI (11.2%), BERGEPAINT (9.6%) and SREINFRA (6.4%) were the top gainers in terms of open interest.

• INFRATEL (-10.2%), NBCC (-6.8%), M&M (-6.1%), BOSCHLTD (-3.3%) and JPASSOCIAT (-3.2%) were the top losers in terms of open interest.

• The Nifty Put Call Ratio (PCR) finally stood at 1.70 for October month contract.


Derivative Idea (17-10-2017)

Tata Motors DVR witness short unwinding on Monday’s trade. It is trading above its resistance level of 242.

Now what to expect??

Minor hurdle at 248….Above 248 rally remain continue till 260—265 and then to 275++ mark in days to come. 

Support and stop loss below 240

Current chart pattern and derivatives data suggest that we expect further rally in coming sessions.


Trading Recommendation (17 Oct 2017)

Buy TATA Motors DVR above 248 Stop loss 240(on closing basis) Target 260—265 and then to 275++.


Result Today


Bajaj Auto Limited

Wipro Limited

Axis Bank Limited

ACC Limited


More Will Update Soon!!

Monday, October 16, 2017

Updates on Bullion and Energy Levels 16th October 2017


Updates on Bullion and Energy Levels 16th October 2017

Mixed US economic data and comments from Fed officials has increased uncertainty about Fed’s monetary policy. Geopolitical tensions are high as the US and South Korean navies on Monday began a joint drill. Tensions in Middle-east rose as Iraqi soldiers moved late Sunday to take over oil fields in the northern city of Kirkuk. Catalan President faces a deadline to clarify to the Spanish government whether he’s actually declared independence for the region. However, weighing on gold is continuing firmness in US equity market. ETF outflows also show weaker investor interest in gold. 

Gold import surges over 2-fold to $16.95 billion in first half of 2017-18


Crude oil futures moved higher on Friday on signs of bullish demand from China and the US. Chinese crude imports rose by roughly 1 million barrels a day in September to 9 million barrels a day, while US consumer sentiment and retail sales were up last month, data showed this morning. That eased investor concerns that global demand is set to weaken over the next year. Traders also got some support with Baker Hughes report that the number of active U.S. rigs drilling for oil fell by 5 to 743 this week after posting a fall of 2 rigs last week.


Copper futures traded higher on MCX as speculators raised bets, amid a firming global trend and pick up in spot demand. Further, rising demand from consuming industries at domestic spot markets also supported the upside.

Technical Level


Gold


Support at 29650 and Resistance at 29900

Above 29900 rally remain continue till 30150—30300++ mark in days to come else could touch its support level of 29650.

Fresh selling can be initiate below 29650


Silver


Above 40500, rally remain continue till 40850—41000 and then to 41300++ mark else could touch its support level of 40200 mark.

Fresh selling can be initiate below 40200.


Crude


Support at 3335 and Resistance at 3400

Break and sustain above 3400 will take it to 3450—3480++ mark else could touch its support level of 3335 mark.

Fresh selling can be initiated below 3335 


Natural Gas


Support at 191 and Resistance at 195

Break and sustain below 191 will take it to 189—186 mark else could touch its resistance level of 195.

Fresh buying can be initiate above 195


More will update soon!!!

Copper prices reached their highest level in 3 years


 Copper prices reached their highest level in 3 years

LME Copper prices gained momentum and surged by more than 3% as global investors chose to react to news of selective monetary easing in China once Chinese markets returned from week long holiday. People's Bank of China's had announced on Sept. 30 that it would cut the reserve requirement ratio (RRR) for some banks that meet certain requirements for lending to small business and the agricultural sectors. Demand prospects brightened further after the International Monetary Fund raised Chinese economic growth forecast for 2017 and 2018 to 6.8% and 6.5% respectively, both 0.1 percentage point higher than its previous forecast in July. Besides, persistent decline in LME stocks has already pulled the inventories lower by 5 percent so far in October.

Source: Reuters


More will update soon!!!

Update on Technical Pick of Biocon


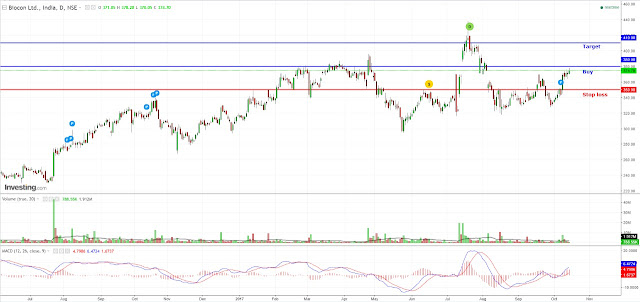
Technical Pick – Biocon


• Biocon Ltd is finding support at 350 and resistance above 380

•On Daily chart,  Biocon Ltd  is showing breakout point above 380 level.Break and sustain above 380 will see nonstop rally till 410++ in weeks to come.

•MACD too has given the positive crossover (Buy signal) which indicates that upper side seems certain in it.

•Traders don’t go for aggressive or positional selling at all because trend looks positive and we expect rally to remain continue till 410++ mark in coming weeks. 
For positional trade, stop loss seeing below 350 on closing basis which in unlikely to breach in near terms. 


Trading Recommendation(16th October 2017)

Buy Biocon above 380 and add more in panic around 370 for the initial upside target of 410++ mark with stop loss below 350 on closing basis.


More will update soon!!!

Update on Technical Pick – ONGC


Technical Pick – ONGC

• ONGC Ltd is finding support at 170 and resistance above 172.

•On Daily chart,Break and sustain above 172 will see nonstop rally till 175---180++ in weeks to come.

•ONGC Ltd has been trading in a broader range of 133---315 for last one year.

•RSI and MACD too showing positive divergence which indicates that upper side seems certain in it. 

•Traders don’t go for aggressive or positional selling at all because trend looks positive and we expect rally to remain continue till 175---180++ mark in coming weeks. 
For positional trade, stop loss seeing below 170 on closing basis which in unlikely to breach in near terms. 


Trading Recommendation (16 Oct 2017)


Buy ONGC above 172 and for the initial upside target of 175--180++ mark with stop loss below 170 on closing basis.


More will update soon !!

Oil jumps on fears of new Iran sanctions, Iraq conflict.


 Oil jumps on fears of new Iran sanctions, Iraq conflict.

Oil markets jumped in early today on concerns over potential renewed U.S. sanctions against Iran as well as conflict in Iraq, while a falling U.S. rig count supported prices there. U.S. President Donald Trump struck a blow against the 2015 Iran nuclear deal on Friday, defying both U.S. allies and adversaries by refusing to formally certify that Tehran is complying with the accord even though international inspectors say it is. Under U.S. law, the president must certify every 90 days to Congress that Iran is complying with the deal. The U.S. Congress will now have 60 days to decide whether to re-impose economic sanctions on Tehran that were lifted under the pact.
During the previous round of sanctions against Iran, some 1 million barrels per day (bpd) of crude oil supplies were cut off global markets. While analysts said they did not expect renewed sanctions to have such a big impact again, especially as the United States would likely act alone, they did warn that such a move would be disruptive. Drillers cut five oil rigs in the week to Oct. 13, bringing the total count up to 743, the lowest since early June.


(Source: Investing)


More will update soon!!!